Sunday, 30 August 2020

Straits Times Index (Week of 31 August 2020)

During the week of 24 August 2020, the Straits Times Index (STI) closed at 2,539.63 points. How will it fare for the week of 31 August?

Picture: Daily chart of STI, via TradingView. 

Gap was closed, but the bull's weakness prevails

Previously (STI analysis article for the week of 24 August), I mentioned that the bulls might make an attempt to close the gap formed between 19 and 20 August. 

Indeed, the bulls managed to close the gap. However, if you look at the candlestick for 25 August, it had a tall upper shadow - meaning that the bull's further attempt towards the 1st resistance region after closing the gap was cut short.

The bears put up a strong fight after all

The last three days of the week of 24 august showed bearish movements, especially when the bull's attempt towards the 1st resistance region was cut short once again on last Friday.

In overall, the bulls won. But, it was a slight margin.  

What can happen to STI next week?

Looking at the movement and the two tall shadows within a week, it seems that the bears are starting to gain strength. 

With that, I will be expecting to see the bears attempting to break below the 2nd support region next week. Therefore, that region is going to be an important area for any price action.

I would also like to wish all Malaysians a Happy National Day!


Sunday, 23 August 2020

Straits Times Index (Week of 24 August 2020)

During the week of 17 August 2020, the Straits Times Index (STI) closed at 2,528.54 points. How will it fare for the week of 24 August? 

Picture: Daily chart of STI, via TradingView.


The bulls lost the battle 

In my previous STI analysis article for the mid-week of 17 August (the article has since been removed), I mentioned that the bulls may regain control and make a turnaround. 

However, it did not happen. The bears accelerated and caused a gap down on Thursday, with its low touching the 2nd support region.

The bulls tried again, but failed again

Before the market closed on Thursday, the bulls made an attempt to get itself above the support region. It even opened higher the next day. However, it did not last for long - the bears took back control and brought it down again. 

Evidently, the bears had won during the week of 17 August. 

What can happen to STI next week? 

Despite being pulled down by the bears, both Thursday and Friday's close were at the same level that it seemed to have created a temporary support to prevent STI from falling further. 

With that, I am looking at a possible bullish attempt to cover the previous down gap between last Wednesday and Thursday early next week. If the bulls succeed in their attempt, 1st resistance region will be its price target. 

A failure, however, will bring the STI down back in an attempt to breach the 2nd support region.


Removal of STI mid-week edition 

Unfortunately, I have to remove this edition. There are more priorities I have to focus on and it is definitely unproductive to spend time on a weekday writing an article, especially when I am doing this for free. 

Moreover, too much analysis brings in paralysis. I had personally found it way harder to analyse the movement of STI just providing updates using only two to three candlesticks.

Therefore, in the future, The Opportunist Diary shall revert back to its original edition of having a STI analysis article every week.

As for the "Live" STI analysis edition, it will remained unavailable temporarily until I can sort out the video quality issue. There will be an update again on this once it has been resolved.


Saturday, 15 August 2020

Straits Times Index (Week of 17 August 2020)

During the week of 11 August 2020, the Straits Times Index (STI) closed at 2,581.32 points. How will it fare for the week of 17 August? 


Picture: Daily chart of STI, via TradingView.

The bulls recharged and climbed

In my previous STI analysis article for the week of 11 August, I mentioned that it is possible for the bulls to recharge itself and push the STI up towards the 1st resistance region. Also, I mentioned in both articles for the weeks of 3 & 11 August that it may or may not touch the region. 

Indeed, the bulls had succeeded in touching the 1st resistance region after pushing the STI up from the halfway point (between 2nd support and 1st resistance region). 

Evidently, the bulls had won for the week of 11 August. 

Presence of bears were spotted, but looks weak

On Friday (14 August), STI opened lower and ended the week with a red doji. This happened after the bulls managed to touch the 1st resistance region It is a clear sign that some bears had resurfaced at the resistance region and stalled the bullish movement. 

However, these bodies of red candlesticks since the rebound from 2nd support region were small despite their tall shadows - showing that these stalls might be temporary.

What can happen to STI next week?

With that, I am expecting to see some possible resistance by the bears first, followed by another possible bullish movement. This will be an attempt to pierce through the 1st resistance region. 

Therefore, 1st resistance region is going to be an important region to look out for any price movement on either side. 

Coronavirus situation 

The number of coronavirus cases in Singapore had indeed went down substantially as mentioned by the Singapore Ministry taskforce. On 17 August, there will be a ministerial statement on how the government would provide additional support for workers and businesses. This might bring in further alleviation to the STI for the time being. 

However, coronavirus cases around the world had surpassed 20 million last week. 


Sunday, 9 August 2020

Straits Times Index (Week of 11 August 2020)

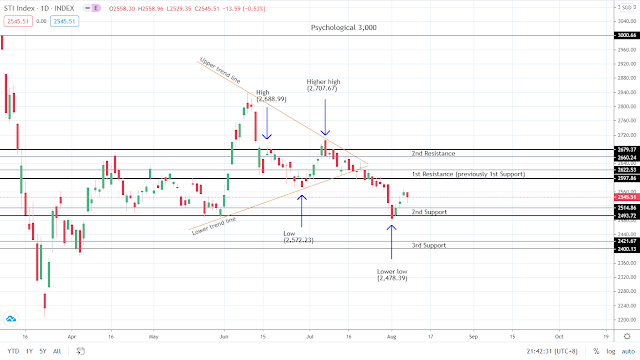
During the week of 3 August 2020, the Straits Times Index (STI) closed at 2,545.51 points. How will it fare for the week of 11 August? 

Do take note that it will be a four-day trading week due to 10th of August being a public holiday, since National Day falls on a Sunday. Therefore, there will not be a mid-week STI analysis article next week.


Picture: Daily chart of STI, via TradingView. 

The bulls met some obstacles 

The bulls gapped up twice on Tuesday, Wednesday and Thursday (4, 5 and 6 August) after it managed to stop the selldown at its 2nd support region.  

On Friday, it met the bears at halfway towards the 1st resistance region after the climb. The bears attempted to pull the STI down back to its 2nd support region.

Nevertheless, the upward movement proves that the bulls had won during the week of 3 August. 

The bears were not that strong too

The bear's appearance at midway also exposed its strength, which was not that strong. 

STI closed as a red hammer candlestick on Friday, which shows that the bears sent the STI down during the early part of the trading day but the bulls took over and pushed it up slightly. The tall lower shadow shows some signs of bullish strength.

What can happen to STI next week? 

With that, it is possible for the bulls to recharge its batteries and attempt to push the STI once again, towards its 1st resistance region early next week. 

As re-iterated in my previous STI analysis article for the week of 3 August, it may or may not touch its 1st resistance region. 

Coronavirus situation in Singapore 

Singapore's coronavirus situation of about 55,000 cases are largely due to cases from the dormitories instead of the community like you and me.  

It was mentioned by the Singapore's multi-ministry task force that Singapore's coronavirus cases is expected to drop significantly as the migrant workers' testing is about to be completed very soon. This may provide some respite to the STI moving forward. 

Happy 55th National Day to Singapore!

Sunday, 2 August 2020

Straits Times Index (Week of 3 August 2020)

During the week of 27 July 2020, Straits Times Index (STI) closed at 2,529.82 points. How will it fare for the week of 3 August 2020? 


Picture 1: Daily chart of STI, via TradingView.

The bears stomped on the gas pedal

In my two previous STI analysis articles (Week of 20 & 27 July), it was mentioned that there is a possible major bearish breakdown towards the 2nd support region.

On last Thursday, the bears accelerated the breakdown and successfully sent the bulls back home, pulling the STI down to its 2nd support region. Apparently, the bears had won during the week of 27 July 2020.

STI touched its 2nd support region

A new low of 2,511.02 points was formed on Thursday, touching its 2nd support region. If you look at the left side of picture 1, you can see this region supporting the price successfully for FOUR times before the bulls dominated and drove the price up in June. This was why the bulls managed to support the price at its 2nd support region and even closed above it to end off the week. 

Evidently, this shows some presence of bullish strength coming back into play.

What can happen to STI next week? 

With that, I am expecting the bulls to make an attempt by pushing the STI back to its previous 1st support region (now called 1st resistance region) early next week. It may or may not touch that region so I believe it is best to adopt a wait-and-see approach.

The 2nd support region is now a key area to look out for any potential price action currently. 

Is the price breakdown done? 

After STI stalled in its 2nd support region, we may be led to think that the price breakdown effect from the symmetrical triangle has finished playing out. However, I don't think it is done yet. There could be more bearishness later on which has the potential to reach its 3rd support region. 

Special STI analysis edition via Facebook live and mid-week STI analysis!

Very soon, I will be setting up and going into Facebook live to analyse on the STI every week in addition to my weekly STI analysis articles. Not to worry, they will sing the same tune. 

I will not go Facebook live to say that STI is going down and afterwards, publish an article saying that STI is going up.

This Facebook live is a platform for me to practice stepping out of my comfort zone and to elaborate my viewpoints using my mouth right before I publish my article. This would mean that viewers can choose to watch my video on Facebook and/or read my STI analysis article in blog.

There will also be a mid-week STI analysis edition which I will be providing updates on the STI current movement every Wednesday in my blog page. This will be a shorter article instead.

So, stay tune for more updates!