Sunday 6 December 2020

Straits Times Index (Week of 7 November 2020)

The Straits Times Index (STI) ended at 2,839.89 points on last Friday - 160 points more to the psychological 3,000 level which was last seen during pre-coronavirus pandemic. 

Picture: STI daily chart, via TradingView


Correction back to 3rd resistance 

As mentioned last week, the STI had indeed underwent a correction back to the 3rd resistance after a long, sharp rally. Another extremely tall red candlestick was seen on 30 Nov, last Monday. 

Since STI took a turn back from the 2,900 level, this shows that a temporary resistance was formed.

Support was intact at 3rd resistance 

Over the next four days after a sharp decline on last Monday, buyers began starting to pick back up on the STI. 

Tuesday, Wednesday and Thursday were accumulation days where "green candlesticks without a noticeable rise" was seen.

On Friday, STI opened above the resistance level and ended higher. The bulls were back in action again.

What can happen to STI next week?  

The STI will be looking to return towards the previous high (resistance) prior to the fall - which is the 2,900 level as mentioned earlier just now. 

Do beware! I personally do not think this correction is over. A correction should bring STI back much more instead of very little. This is more likely when the STI had already flew 500 points.

This 2nd bullish attempt may be a failure when approaching towards its previous high. Stay cautious.

Monday 30 November 2020

Straits Times Index (Week of 30 November 2020)

 Straits Times Index (STI) ended at 2,855.82 points last Friday.

Picture: Daily chart of STI via TradingView.

The bulls are in total control 

The STI faced a slight stall on 19 Nov at the 3rd resistance region last week, but resumed its bull charge and pierced through the resistance level. 

Since the certainty outcome of the US election and some news regarding coronavirus vaccine, the buyers gobbled up all the blue chip stocks and pushed the STI to break the 2nd support, 1st resistance, 2nd resistance and also 3rd resistance regions. 

Even with some slight profit-taking, the bulls are clearly dominating the STI. 

Technical adjustment was seen 

On last Wednesday, 25 Nov, the STI had a tall red candlestick for the first time since the huge rally. This came as a technical adjustment due to temporary excessive overbought situation - also a profit taking day. 

On Thursday and Friday, there were attempts by the bulls to possibly continue its way once again. 

What can happen to STI next week? 

With the 3rd resistance broken and no resistance in sight, the next bullish resistance would therefore, be the psychological 3,000 level. 

However, with the tall red candlestick, it may be an indication pointing to a correction back to the 3rd resistance region first. This is especially so after a long sharp rally. 


Sunday 15 November 2020

Straits Times Index (Week of 16 November 2020)

Pfizer's strong breakthrough with a 90% effective Coronavirus vaccine and Joe Biden's victory in the US election had propelled the Straits Times Index (STI) upward to close at 2,711.39 points last Friday. 

Will there be any more to come?


The bulls continued its streak 

Despite facing a bearish day on 6 November (last Friday) which happened below the 1st resistance, the bulls continued to push STI further. It broke through the 1st and even the 2nd resistance by having a powerful gap up between last Monday and Tuesday.

This was mainly due to the influence from the US as the global market favoured Joe Biden's victory to deal with the Coronavirus plus a possible end to Coronavirus in the future. 

A short hiccup seen slightly above 2nd resistance 

The week of 9 November was made up of five green candlesticks, proving that the bulls had indeed dominated and won. 

A slight hiccup was seen on Thursday and Friday as the STI actually opened below its previous close for two days. This is where some profit-taking can be seen in the chart.

This shows that the bulls had lost some strength for now. 

What can happen to STI next week? 

With that, I might see the bulls still attempting a final weak push towards the newly added 3rd resistance and it may or may not touch the level first. 

After climbing sharply over the past two weeks, there may be a slight bearish retracement coming soon. Such retracement would be temporary in my opinion. 

Sunday 8 November 2020

Straits Times Index (Week of 9 November 2020)

With Joe Biden winning the election and becoming the 46th US President, what might happen to the Straits Times Index (STI) for the week of 9 November?

Picture 1: STI daily chart via TradingView

The bears converted into bulls 

Last week, I mentioned that after reaching the 3rd support region, the STI may stage a rebound which can be short-lived. However, it was totally unexpected that this sharp fall had actually resulted in a sharp rise - even higher than the level prior to the fall. 

Evidently, the bulls won during the week of 2 November.

STI touches the 1st resistance 

With the bulls advancing strongly, it managed to pierce through the 2nd support region with strong gap up momentum. These were all in the midst of waiting for the election result to be released. 

It touches the 1st resistance region and last Friday's candlestick was a red one. This shows some selling pressure right there.

What can happen to the STI next week?

The election result was released yesterday, after the market closed for the week. These price movements were in waiting mode back then. 

Now that we know Joe Biden has defeated Donald Trump, this major news will create high turbulence in the market next week. Therefore, my take would be to stay on the sideline and have a wait-and-see approach first.

The STI can go either way, up or down - it can be extremely irrational next week. 


Sunday 1 November 2020

Straits Times Index (Week of 2 November 2020)

Alright, enough of the formality and let's straight dive into it.

Picture 1: STI daily chart via TradingView


Millions of bears crossed the road, not the chickens

The Straits Times Index (STI) closed at 2,423.84 points last Friday. A wait-and-see approach was recommended in my previous analysis.

Indeed, thsi wait was over as the bears emerged as the winner, dominating the STI in reds by breaking down the 2nd support region. The week of 26 October were all red candlesticks - the bears won apparently. 

The bearish strength was extremely strong especially during the last three days, forming a three black crow pattern. The price even gapped down during each day's opening from its previous close. 

STI reached the 3rd support region

The strong bearish momentum had broken the previously strong 2nd support region, which ended up resting on the 3rd support currently with no bottom in sight yet.

It had also broken its previous low.

What can happen to the STI next week? 

As STI touched its 3rd support region, I am expecting a possible temporary rebound by the bulls for a tiny pickup - but likely to be short-lived.

In overall, the bears are still in control especially with the price gapping down with solid red candlesticks. With that, we can expect a bearish continuation plus a possible breach in the 3rd support region in my opinion.

The US Presidential Election 2020

Since the US Presidential Election 2020 will be held on 3 November, the STI is very likely to experience high volatility during this week. 

This is especially so when the number of coronavirus cases exceeded 100,000 cases in a single day, tensions in America will definitely be high which might bring in potential civil unrest even after the election. 

You might want to avoid trading and stay cautious on the sideline.  

Monday 26 October 2020

Straits Times Index (Week of 26 October 2020)

During the week of 19 October 2020, the Straits Times Index (STI) closed at 2,537.39 points. What will this week bring to the STI? 

P.S. Some delays in my weekly STI analysis due to personal matters during the weekends.

Picture 1: STI daily chart via TradingView.

The retest is still ongoing

This chart is based on last Friday's close (23 October). As what I had mentioned last week, the STI is currently retesting the 2nd support region.

The bulls succeeded in a weak way

While retesting the 2nd support region, the bulls managed to come up with a rebound on two occasions (16 & 19 October). However, the rebound was not strong - green candlestick bodies were tiny and there were taller upper shadows than its lower shadows. 

This was proven to be true as this was followed by last Tuesday and Wednesday's tall red candlesticks. 

The bulls succeeded the second time

On last Thursday and Friday, the STI made a rebound for the second time. Last Friday's close placed the bulls at an advantage as the bulls managed to push the STI up despite the its early decline.

What can happen to the STI this week? 

Although two rebounds were made, it still does not strongly prove that the bulls are in the lead. This is especially with the appearance of two tall red candlesticks last Tuesday and Wednesday. Furthermore, a lower high was formed which is not advantageous for the bulls. 

Therefore, my personal stand would remain as last week - a wait-and-see approach as the retest of the 2nd support region is still going on.

Monday 19 October 2020

Straits Times Index (Week of 19 October 2020)

During the week of 12 October 2020, the Straits Times Index (STI) closed at 2,533.02 points. How will it fare for the week of 19 October 2020? 

P.S. Was late in posting a STI weekly analysis due to some priorities on weekends.

Picture 1: Daily chart of STI, via TradingView.


The bears retest the 2nd support region 

Note that this chart is still based on last Friday's closing (16 Oct). I highlighted last week that the bears may conduct a throwback towards the 2nd support region to test the demand.

Yes, it indeed happened on last Wednesday and Thursday. The STI started to decline at the midpoint between the 2nd support region and the 1st resistance region. 

A lower high was formed 

While declining from the midpoint, a lower high was formed at 2,570.19 points on last Tuesday. With lower high and lower low formed, STI is considered to be a downtrend.

What can happen to STI this week? 

Declining from the midpoint towards the 1st resistance would proved that there is a strong supply throwing down at this point in time. 

The throwback was done, with the bears pulling STI down. However, whether the region is able to withstand the supply side is still unknown. Since this is a retest of the 2nd support region, it would be safer to have a wait-and-see approach. 

The bears are at an advantage for now. 

Monday 12 October 2020

Straits Times Index (Week of 12 October 2020)

During the week of 5 October 2020, the Straits Times Index closed at 2,532.96 points. How will it fare next week for the week of 12 October 2020? 

Picture: Daily chart of STI, via TradingView.

The bulls broke the broken 2nd support region

Last week, the bulls managed to make use of the consolidated falling wedge pattern to make a bullish move. It breached the old 2nd support region and stayed above there.

This breakthrough came after two advancements to pullback towards its broken 2nd support region for a retest.

Evidently, the bulls had won during the week of 5 October. 

Breakout is not strong

Yes, this bullish breakout is considered a breakthrough. I was expecting the breakout to be sharp but it turned out not as strong as it was supposed to like the bullish movements in April and June. 

Furthermore, last Friday was a full red marubozu candlestick. The bears throughout the entire session and it was pretty prominent. 

What can happen to the STI next week? 

With that, the bears may attempt to initiate a throwback towards the 2nd support region once again. This time, it may be to retest the demand side at the 2nd support region.

Should the demand be able to withstand the bearish throwback, the 1st resistance can be the next target moving forward. 

Therefore, this 2nd support region will still be a critical area to look out for any price action. 

Monday 5 October 2020

Straits Times Index (Week of 5 October 2020)

STI closed at 2,496.11 points during the week of 28 September 2020. How will it fare next week for the week of 5 October 2020?

Picture: Daily chart of STI, via TradingView.

The bulls made a slight advancement 

The bulls made a pullback to retest the broken 2nd support region, as mentioned in my previous STI analysis article. 

However, STI failed to break the resistance with two red candlesticks on last Tuesday and Wednesday.

The bulls made a 2nd advancement

Without giving up, the bulls continued to be persistent by making a 2nd round of retesting towards the region. Based on Thursday and Friday's candlesticks, it shown signs of bullish strength. 

Friday's candlestick was a strong indication. The tall lower shadow would mean that during the session, the bears attempted to pull the STI down but was met with strong demand buying up.

Evidently, the bulls had won slightly for the week of 28 Sep. 

What can happen to STI next week? 

With the pullback touching the 2nd support region and closing on it, this region will be critical to watch out for any price movements. Should the STI be able to return towards above its 2nd support region, the bulls may stand a good chance to dominate the movement. 

This would be a long standstill as I am still looking for a breakthrough in STI on either side as mentioned before. 

Sunday 27 September 2020

Straits Times Index (Week of 28 September 2020)

During the week of 21 September 2020, Straits Times Index (STI) closed at 2,472.28 points. How will it fare for the week of 28 Sep? 

Daily chart of STI, via TradingView.

The bears overturned its losses

The bulls struggled to support the STI while fluctuating inside the key 2nd support region and the bears made full use of advantage to break below it. 

On Monday and Tuesday, STI dived below its 2nd support since April.

Evidently, the bears had won during the week of 21 Sep.

It may be a false breakthrough?

As previously mentioned, I was expecting a breakthrough after a period of stagnation in STI. The bears did made a breakthrough with a breakdown in STI but could this be a false break? 

The last three days, especially on Wednesday and Friday, showed a considerably strong green candlesticks - pointing to a bullish presence. 

If this is really a breakthrough on the downside, the drop should be as strong as what happened in August which created a lower low. Furthermore, the bulls should not pick back up so soon. 

What can happen to STI next week? 

These indications are pointing to a possible pullback to retest the broken 2nd support region which is now a resistance.

No doubt, it is still a wait-and-see approach as neither sides are decisive and strong enough yet to take charge of the STI's overall movement. 


Monday 21 September 2020

Straits Times Index (Week of 21 September 2020)

During the week of 14 September 2020, the Straits Times Index (STI) closed at 2,497.71 points. How will it fare for the week of 21 September? Let's take a look. 

Daily chart of STI, via TradingView.


The bulls forced its way

Despite the price hovering below the 2nd support region, the bulls managed to get the STI back inside it last Wednesday. Over the next two days, the STI stayed supported on the region. 

Evidently, the bulls had won for the week of 14 September - a slight bullish victory still. 

The bears were not strong after all 

The week of 14 September shows further bearish weakness after a failure of pulling the STI towards the 3rd support region. As mentioned, this is a continuation of a long standstill for close to two months. 

What can happen to the STI next week? 

In my previous article, the stagnancy is looking to end soon with a breakthrough on either side. Judging from the price action, the bulls have a slightly advantageous position to launch a breakout towards its 1st resistance. Of course, this is provided that its own 2nd support region is intact to prevent the bears from getting its way. 

A cautious approach would be to continue stay on the sideline and wait first. 


Sunday 13 September 2020

Straits Times Index (Week of 14 September 2020)

During the week of 7 September 2020, the Straits Times Index (STI) ended at 2,490.09 points. How will it fare for the week of 14 September? 

Picture 1: Daily chart of STI, via TradingView.

The bulls tried, but were too weak

In my previous STI analysis, I mentioned that the bulls might look for a short bullish attempt which I am not so optimistic on its strength towards the 1st resistance.

However, as soon as the bulls tried to get itself above the 2nd support region, the bears came in and pulled the STI down again and again. 

STI breached below the 2nd support region 

The STI continued to slope downwards, eventually breaching below the 2nd support region on Wednesday. 

Wednesday, Thursday and Friday's lows have breached its lower low of 2,478.39 points. The bears had definitely won during the week of 7 September.

An imminent breakthrough!

Picture 2: Imminent breakthrough in the daily chart of STI, via TradingView.

There has been a period of push and pull battle between the bulls and the bears. Even though the bears did won by causing the STI to slop down gradually, a stagnancy in overall is still being seen here. 

However, another breakthrough is approaching. This will stop the stagnancy and get STI to either shoot up or break down. This is why I did not make any comment on what can happen to STI next week - it is best to stay clear and wait for confirmation first.  

It is coming.

Sunday 6 September 2020

Straits Times Index (Week of 7 September 2020)

During the week of 31 August 2020, Straits Times Index (STI) closed at 2,509.64 points. How will it fare for the week of 7 September? 

Picture: Daily chart of STI, via TradingView.

Tug-of-war between bulls and bears 

In my previous STI analysis article (31 August), I mentioned that the bears might make an attempt to break the 2nd support region.

The bulls and bears were fighting off each other with no major movement seen in the chart. 

Bearish breakdown as breakthrough

This lasted until Friday, when STI gapped down by opening at the low-end of the 2nd support region. Unsurprising, the bears had won during the week of 31 August. 

However, Friday's candlestick showed slight bullish movement attempting to make a rebound from the 2nd support region. This was likely due to a temporary oversold condition after a sharp fall between Thursday close and Friday's opening. 

In the end, STI is still being supported at the region. As mentioned before, this support region is very strong with its proven capability to prevent it from breaking down since April.

What can happen to STI next week? 

With that, I am still going to be emphasising the importance of the 2nd support region - for any potential price action coming out from there.

The bulls may look to make a short bullish attempt early next week, which I am not that optimistic about based on how bearish the STI has been since June.

Should the 2nd support region breaks, we should see more bearish movement towards the 3rd support region.

Sunday 30 August 2020

Straits Times Index (Week of 31 August 2020)

During the week of 24 August 2020, the Straits Times Index (STI) closed at 2,539.63 points. How will it fare for the week of 31 August?

Picture: Daily chart of STI, via TradingView. 

Gap was closed, but the bull's weakness prevails

Previously (STI analysis article for the week of 24 August), I mentioned that the bulls might make an attempt to close the gap formed between 19 and 20 August. 

Indeed, the bulls managed to close the gap. However, if you look at the candlestick for 25 August, it had a tall upper shadow - meaning that the bull's further attempt towards the 1st resistance region after closing the gap was cut short.

The bears put up a strong fight after all

The last three days of the week of 24 august showed bearish movements, especially when the bull's attempt towards the 1st resistance region was cut short once again on last Friday.

In overall, the bulls won. But, it was a slight margin.  

What can happen to STI next week?

Looking at the movement and the two tall shadows within a week, it seems that the bears are starting to gain strength. 

With that, I will be expecting to see the bears attempting to break below the 2nd support region next week. Therefore, that region is going to be an important area for any price action.

I would also like to wish all Malaysians a Happy National Day!


Sunday 23 August 2020

Straits Times Index (Week of 24 August 2020)

During the week of 17 August 2020, the Straits Times Index (STI) closed at 2,528.54 points. How will it fare for the week of 24 August? 

Picture: Daily chart of STI, via TradingView.


The bulls lost the battle 

In my previous STI analysis article for the mid-week of 17 August (the article has since been removed), I mentioned that the bulls may regain control and make a turnaround. 

However, it did not happen. The bears accelerated and caused a gap down on Thursday, with its low touching the 2nd support region.

The bulls tried again, but failed again

Before the market closed on Thursday, the bulls made an attempt to get itself above the support region. It even opened higher the next day. However, it did not last for long - the bears took back control and brought it down again. 

Evidently, the bears had won during the week of 17 August. 

What can happen to STI next week? 

Despite being pulled down by the bears, both Thursday and Friday's close were at the same level that it seemed to have created a temporary support to prevent STI from falling further. 

With that, I am looking at a possible bullish attempt to cover the previous down gap between last Wednesday and Thursday early next week. If the bulls succeed in their attempt, 1st resistance region will be its price target. 

A failure, however, will bring the STI down back in an attempt to breach the 2nd support region.


Removal of STI mid-week edition 

Unfortunately, I have to remove this edition. There are more priorities I have to focus on and it is definitely unproductive to spend time on a weekday writing an article, especially when I am doing this for free. 

Moreover, too much analysis brings in paralysis. I had personally found it way harder to analyse the movement of STI just providing updates using only two to three candlesticks.

Therefore, in the future, The Opportunist Diary shall revert back to its original edition of having a STI analysis article every week.

As for the "Live" STI analysis edition, it will remained unavailable temporarily until I can sort out the video quality issue. There will be an update again on this once it has been resolved.


Saturday 15 August 2020

Straits Times Index (Week of 17 August 2020)

During the week of 11 August 2020, the Straits Times Index (STI) closed at 2,581.32 points. How will it fare for the week of 17 August? 


Picture: Daily chart of STI, via TradingView.

The bulls recharged and climbed

In my previous STI analysis article for the week of 11 August, I mentioned that it is possible for the bulls to recharge itself and push the STI up towards the 1st resistance region. Also, I mentioned in both articles for the weeks of 3 & 11 August that it may or may not touch the region. 

Indeed, the bulls had succeeded in touching the 1st resistance region after pushing the STI up from the halfway point (between 2nd support and 1st resistance region). 

Evidently, the bulls had won for the week of 11 August. 

Presence of bears were spotted, but looks weak

On Friday (14 August), STI opened lower and ended the week with a red doji. This happened after the bulls managed to touch the 1st resistance region It is a clear sign that some bears had resurfaced at the resistance region and stalled the bullish movement. 

However, these bodies of red candlesticks since the rebound from 2nd support region were small despite their tall shadows - showing that these stalls might be temporary.

What can happen to STI next week?

With that, I am expecting to see some possible resistance by the bears first, followed by another possible bullish movement. This will be an attempt to pierce through the 1st resistance region. 

Therefore, 1st resistance region is going to be an important region to look out for any price movement on either side. 

Coronavirus situation 

The number of coronavirus cases in Singapore had indeed went down substantially as mentioned by the Singapore Ministry taskforce. On 17 August, there will be a ministerial statement on how the government would provide additional support for workers and businesses. This might bring in further alleviation to the STI for the time being. 

However, coronavirus cases around the world had surpassed 20 million last week. 


Sunday 9 August 2020

Straits Times Index (Week of 11 August 2020)

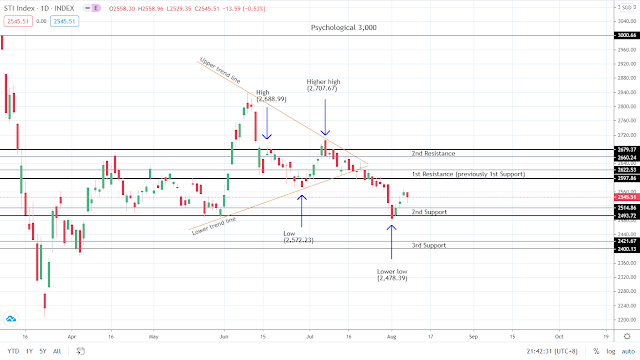
During the week of 3 August 2020, the Straits Times Index (STI) closed at 2,545.51 points. How will it fare for the week of 11 August? 

Do take note that it will be a four-day trading week due to 10th of August being a public holiday, since National Day falls on a Sunday. Therefore, there will not be a mid-week STI analysis article next week.


Picture: Daily chart of STI, via TradingView. 

The bulls met some obstacles 

The bulls gapped up twice on Tuesday, Wednesday and Thursday (4, 5 and 6 August) after it managed to stop the selldown at its 2nd support region.  

On Friday, it met the bears at halfway towards the 1st resistance region after the climb. The bears attempted to pull the STI down back to its 2nd support region.

Nevertheless, the upward movement proves that the bulls had won during the week of 3 August. 

The bears were not that strong too

The bear's appearance at midway also exposed its strength, which was not that strong. 

STI closed as a red hammer candlestick on Friday, which shows that the bears sent the STI down during the early part of the trading day but the bulls took over and pushed it up slightly. The tall lower shadow shows some signs of bullish strength.

What can happen to STI next week? 

With that, it is possible for the bulls to recharge its batteries and attempt to push the STI once again, towards its 1st resistance region early next week. 

As re-iterated in my previous STI analysis article for the week of 3 August, it may or may not touch its 1st resistance region. 

Coronavirus situation in Singapore 

Singapore's coronavirus situation of about 55,000 cases are largely due to cases from the dormitories instead of the community like you and me.  

It was mentioned by the Singapore's multi-ministry task force that Singapore's coronavirus cases is expected to drop significantly as the migrant workers' testing is about to be completed very soon. This may provide some respite to the STI moving forward. 

Happy 55th National Day to Singapore!

Sunday 2 August 2020

Straits Times Index (Week of 3 August 2020)

During the week of 27 July 2020, Straits Times Index (STI) closed at 2,529.82 points. How will it fare for the week of 3 August 2020? 


Picture 1: Daily chart of STI, via TradingView.

The bears stomped on the gas pedal

In my two previous STI analysis articles (Week of 20 & 27 July), it was mentioned that there is a possible major bearish breakdown towards the 2nd support region.

On last Thursday, the bears accelerated the breakdown and successfully sent the bulls back home, pulling the STI down to its 2nd support region. Apparently, the bears had won during the week of 27 July 2020.

STI touched its 2nd support region

A new low of 2,511.02 points was formed on Thursday, touching its 2nd support region. If you look at the left side of picture 1, you can see this region supporting the price successfully for FOUR times before the bulls dominated and drove the price up in June. This was why the bulls managed to support the price at its 2nd support region and even closed above it to end off the week. 

Evidently, this shows some presence of bullish strength coming back into play.

What can happen to STI next week? 

With that, I am expecting the bulls to make an attempt by pushing the STI back to its previous 1st support region (now called 1st resistance region) early next week. It may or may not touch that region so I believe it is best to adopt a wait-and-see approach.

The 2nd support region is now a key area to look out for any potential price action currently. 

Is the price breakdown done? 

After STI stalled in its 2nd support region, we may be led to think that the price breakdown effect from the symmetrical triangle has finished playing out. However, I don't think it is done yet. There could be more bearishness later on which has the potential to reach its 3rd support region. 

Special STI analysis edition via Facebook live and mid-week STI analysis!

Very soon, I will be setting up and going into Facebook live to analyse on the STI every week in addition to my weekly STI analysis articles. Not to worry, they will sing the same tune. 

I will not go Facebook live to say that STI is going down and afterwards, publish an article saying that STI is going up.

This Facebook live is a platform for me to practice stepping out of my comfort zone and to elaborate my viewpoints using my mouth right before I publish my article. This would mean that viewers can choose to watch my video on Facebook and/or read my STI analysis article in blog.

There will also be a mid-week STI analysis edition which I will be providing updates on the STI current movement every Wednesday in my blog page. This will be a shorter article instead.

So, stay tune for more updates! 


Sunday 26 July 2020

Straits Times Index (Week of 27 July 2020)

During the week of 20 July 2020, Straits Times Index (STI) closed at 2,579.51 points. How will it fare for the week of 27 July 2020? Do take note that it is another four-day trading week as it will be Hari Raya Haji next Friday. 


Picture 1: Daily chart of STI, via TradingView.

The bulls exposed its weakness

In my previous STI analysis article for the week of 20 July, I was expecting a possible price breakdown towards its 2nd support region. However, the bulls supported the price drop on 20 July (last Monday) and staged another bullish attempt towards its 1st resistance region on 21 July (last Tuesday). 

Picture 2: Daily chart of STI depicting its bullish weakness, via TradingView.

Nevertheless, the bullish attempt on 21 July did not touch its 1st resistance region and the day ended with a doji. This was unlike its previous attempt where its bullish attempt on 15 July managed to touch its 1st resistance region. Evidently, this is a sign of bullish weakness.

The bears have woken up

On Friday, the STI made a decisive breakdown below its 1st support region. It formed a low of 2,572.93 points - merely 0.7 points away from its previous low. Evidently, this is not going to be an uptrend and the bears have won during the week of 20 July. 

It is highly unlikely for price to make a U-turn this time like what happened during its previous lower low at 2,572.23 points*. The bears have been very consistent in their strength over the past three weeks. 


Picture 3: Daily chart of STI showing a symmetrical triangle pattern, via TradingView.

Also, as mentioned in my previous STI analysis article (20 July), there is a possible major movement after STI consolidated in the symmetrical triangle since June. The movement is still currently playing out since the breakdown of its lower trend line on 17 July.

Bears charging ahead

With that, I will be re-iterating my outlook on the STI as my previous article. I am expecting STI to continue its bearish breakdown possibly towards its 2nd support region. 

This is in spite of a possible pullback to retest its broken 1st support region first - now a resistance region.  


*Jian Wu would like to clarify that the lower low of the chart was a typo error in his previous STI analysis articles. It is actually 2,572.23 instead of 2,572.33, and has been corrected.

Sunday 19 July 2020

Straits Times Index (Week of 20 July 2020)

During the week of 13 July 2020, the Straits Times Index (STI) closed at 2,618.48 points. How will it fare for the week of 20 July?

Picture 1: Daily chart of STI, via TradingView

Tug-of-war between the bulls and bears

In both of my previous STI analysis articles (6 July and 13 July), I re-iterated my viewpoint that the bears could make an attempt to pull the price down from its 1st resistance region back to its 1st support region.

The week of 13 July did seen three occasions when the STI managed to touch its 1st support region - 14, 16 and 17 July (Tuesday, Thursday and Friday). Presence of bulls can still be seen as STI made a pullback to backtest its 1st resistance level, before the bears regained its strength to end the week. Evidently, the bears had won for the week of 13 July.

1st support region remains the key

From the chart, both Thursday and Friday were two red candlesticks and were closing lower and lower. In addition, we have yet to see a green candlestick to determine that price is stalling in its area of demand (1st support region).

Theoretically, as long as price remains well above its 1st support region, we can safely say that an uptrend has been formed. However, there could be difficulties for the uptrend to sustain.  


Picture 2: STI daily chart showing a symmetrical triangle pattern, via TradingView


An incoming major movement!

When all the labels are removed, drawing in both upper and lower trend lines, we would see a symmetrical triangle pattern (as shown in picture 2). From a broader viewpoint, STI is consolidating inside a triangle since June. A consolidation within a tighter and tighter boundary would point to an imminent strong movement on either side.

Bears are dominating? 

From the same picture 2, we can see there is a break down below its lower trend line. With that, I will be expecting a possible major break down in STI which potentially, may touch its 2nd support region next week. 

Despite a possible uptrend, I am not very optimistic on the ability of the 1st support region to withstand the current selling pressure given the number of red candlesticks over the last two weeks. 

Coronavirus situation worldwide

Around the world, the US continues to see a large number of coronavirus cases towards 4 million cases, as India exceeded 1 million cases and Brazil exceeded 2 million cases. As what the World Health Organisation mentioned, it took 100 days to hit 1 millions cases globally. Now, it only takes 100 hours to reach 1 million cases. Apparently, the global coronavirus situation is accelerating on a rampage which could go even faster with more and more people infected. 

Singapore officially in a technical recession

Last week, it was announced that Singapore's Gross Domestic Product (GDP) fell 12.6% in Q2 compared to a year ago. The economy nosedived 41.2% in Q2 from previous quarter. This is much worse than the 3.3% contraction in the previous three months.

With two consecutive quarters of contraction, Singapore has officially entered into a technical recession. 


Friday 10 July 2020

Straits Times Index (Week of 13 July 2020)

The Straits Times Index (STI) ended a four-day trading week with a closing price of 2,652.65 points on Thursday. With the coronavirus situation in US and the Singapore GE2020, how will it fare for the week of 13 July 2020?

Picture 1: Daily chart of STI, via TradingView

In my previous STI analysis article for the week of 6 July 2020, I was expecting the bears to make an attempt to pull the STI down to its 1st support after the bulls have touched the 1st resistance region.

Bulls continued its lead, until..

On Monday, the bulls continued its way in an attempt to pierce through the 1st resistance region. However, it was met with a heavy selldown on Tuesday despite opening higher and creating a new higher high at 2,707.67 points. This created a throwback to its 1st resistance region as a backtest of a possible new support.

Are the bears awaken? 

The throwback seemed to depict a tug-of-war between the bulls and the bears, until the STI experienced a second selldown on Thursday. This time, STI broke down below its 1st resistance region. Despite being in a consolidation (price is now made up of a lower low and a higher high), the breakdown shows a sign of bearishness

What can we expect next week? 

With that, I will continue to leave my expectation unchanged. It shall be the same as my previous STI analysis article for 6 July. The bears could dominate next week's trading session and bring the STI down towards its 1st support region.

The 1st support region shall continue to be an important area to look out for any price action.

Coronavirus situation in US and Singapore GE2020

The coronavirus cases in the US is still worsening as it exceeded 3 million cases. Meanwhile, Trump's decision to have US out of the World Health Organisation.

There are currently speculations of a possible 2nd Circuit Breaker in Singapore after the election. Should Singapore enters into another Circuit Breaker, things could get even disastrous as we can surely expect an accelerated surge in going concern issues around companies and businesses.

As of writing this STI analysis article, the GE2020 results has yet to be released and its possible that roosters will be able to wake up at 5am to view the ongoing process. Because the counting of votes has been delayed to 10pm later.


Sunday 5 July 2020

Straits times Index (Week of 6 July 2020)

During the week of 29 June, the Straits Times Index (STI) ended at 2,652.94 points. How will it fare for the week of 6 July?

Picture 1: STI daily chart via TradingView


Bears were caught off guard

In my previous STI analysis article for the week of 29 June, I was looking at the bears to continue its bearish momentum and accelerate to bring STI down to its 2nd support region. Last Monday, on 29 June, bears did made an attempt and formed a lower low at 2,572.33 points.

It seemed like the bearish momentum has indeed accelerated with the breakdown of its 1st support region, but the bulls made a surprising counter-attack which caused STI to make a U-turn over the next four days. The bulls, had apparently won during the week of 29 June.

Downtrend still remains

Despite the bull's victory, there is still no confirmation that the trend has changed as STI is still in a downtrend. The bears did formed a lower low on Monday, plus the fact that STI is still below its previous high of 2,688.99 points.

What can we expect next week?

As STI touched its 1st resistance region, I will be looking at possible attempts by the bears to pull the price down back to its 1st support region early next week. The 1st support region will therefore, still be a very important region to look out for any price action from there.

Coronavirus situation in US and Singapore GE2020

The coronavirus situation in the US is getting worse, as its 2nd wave caused a spike of nearly 55,000 cases in a single day. The economy is being dealt with further blows and will get more and more unsustainable should it continues to worsen. The STI will inevitably be affected by this situation in the US.

Also, the Singapore GE2020 will also be a major event to the STI. The GE polling day will be held on Friday (Friday is a declared public holiday) and next week shall be a four-day trading week, as the market ends its trading week after Thursday. The GE2020 results will be announced on Friday night, which might create an uproar in STI the week after.

Saturday 27 June 2020

Straits Times Index (Week of 29 June 2020)

During the week of 22 June, the Straits Times Index (STI) ended at 2,604.51 points. How will it fare for the week of 29 June?

Picture 1: STI daily chart via TradingView

Confirmation of downtrend 

After a lower high was formed, price continued downward and touched the 1st support region as expected. It made a lower low last Thursday at 2,574.85 points. STI is therefore, confirmed to be in the bear's territory for now.

STI pierced down its 1st support region twice

There were two occasions when STI broke below its 1st support region.

Firstly, a comment made by the US White House adviser which was "misinterpreted" had sent the STI down during the first half of trading hours on 23 June 2020 and pierced through the 1st support region. It later made a V-shape recovery before the lunch break after the adviser clarified that the China trade deal isn't over.

Secondly, STI gapped down two days later on 25 June below the 1st support region. For this, I did not study into why exactly it happened but it is likely due to the US side with the increasing number of coronavirus cases.

Now, let's analyse the STI to see how it will fare next week.

Weak bullish rebound spotted

In picture 1, STI closed inside the 1st support region (I have changed the colour to white so it is clearer) as a green doji to end the week of 22 June. 

However, the green doji had a taller upper shadow than its lower shadow. This shows that the bulls dominated the trading session initially, but had eventually lost its strength to the bears. Furthermore, the green doji made an unsuccessful attempt to cover the bearish gap between 24 and 25 June as shown in picture 2.  

Picture 2: STI daily chart showing the gap down, via TradingView.

(Note: Some technical traders look at the shadows to confirm a successful gap close but I look at the candlestick's body as it is more accurate.)

A possible look at the 2nd support region

With that, I am still currently bearish on the STI and will be looking at the 2nd support region (shown in picture 1) next week. Although the downtrend isn't strong right now, I am expecting the bears to accelerate its downward movement soon. 

Saturday 20 June 2020

Straits Times Index (Week of 22 June 2020)

The coronavirus pandemic had created problems around many countries globally and Singapore was not an exception. The Straits Times Index (STI) fell below its major 3,000 level once again on the first trading day of March, and had been staying below till today.

Since late March, we have seen a recovery after a massive sell down in the Singapore stock market. The STI ended at 2,634.83 points on 19 June 2020. How will it fare for the week of 22 June?


Picture 1: STI daily chart via TradingView


Bearishness spotted

If you look at the chart, STI had made a high of 2,839.39 points on 9 June 2020 (Labelled "High") before throwing back to the previous low of 2,606.15 points. 

Unfortunately, it was reciprocated by a lower high (Labelled "Lower high") last week which shows that the bullish strength was far from being able to push the STI back to contest against its previous high. Between the bears and the bulls, the bears had surely won for the week of 15 June. 

1st key support is key

With that, I am expecting STI to fall further towards the 1st support region next week (it has yet to touch the highlighted region). Should STI pierced below the 1st region, there may be further bearishness towards the 2nd support region. 

Coronavirus... again? 

The Circuit Breaker enforced on 6 April 2020 was a trigger for a huge decline in Singapore's economy. Although phase 2 had started yesterday, it needed to happen in my opinion as many non-essential businesses are starting to face going concern issues after being out for more than two months.

As if things aren't bad enough, there are currently fears of a possible second wave of coronavirus. Should that really happen, what can happen to STI?